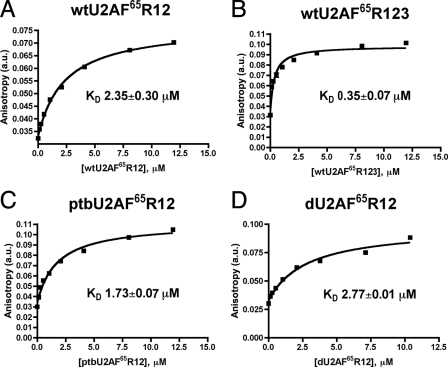
FIGURE 3.
Representative fluorescence anisotropy curves for binding of U2AF65 variants to the polyuridine fluorescein-U20 RNA. Solid lines correspond to the fit of the data using the model described under “Results” with the program Prism4 (Graphpad, Inc.). The average KD and standard deviation of two experiments are given. A, wtU2AF65R12; B, wtU2AF65R123; C, ptbU2AF65R12; D, dU2AF65R12. a.u., arbitrary units.

