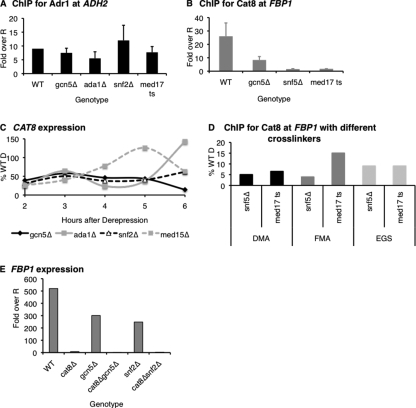
FIGURE 1.
Adr1 and Cat8 show differential dependences on coactivators for stable binding. A, ChIP for Adr1 at ADH2 in coactivator mutants (RBY3, RBY110, RBY111, RBY117, and RBY119). Values, based on QPCR, were first normalized to a negative control locus (TEL) and to an input sample, and then expressed as the -fold over the WT repressed (R) value. B, ChIP for Cat8 at FBP1 in coactivator mutants (CTYTY18, RBY126, RBY127, and RBY123). Values as in A. C, mRNA analysis of CAT8 in WT (W303a) and coactivator mutants (LLTY72, LLTY73, KKTY3, and RBY93). Values, based on QPCR, were first normalized to ACT1 and then expressed as a percent of the maximum WT Derepressed (D) value. D, ChIP for Cat8 with different cross-linkers was performed as described under “Experimental Procedures” with either dimethyl adipimate (DMA) plus formaldehyde (FMA), just FMA, or EGS plus FMA at FBP1 in med17 ts (RBY123) and snf5Δ (RBY127). ChIP/Input values (obtained as in A) were expressed as the percent of ChIP/Input value of the WT strain (RBY135). E, mRNA analysis of FBP1 in WT (W303a), cat8Δ (RBY19), gcn5Δ (EAY12), gcn5Δcat8Δ (EAY16), snf2Δ (KKTY3), and snf2Δcat8Δ (RBY160). Values, based on QPCR, were first normalized to ACT1, and then expressed as the -fold over repressed (R).

