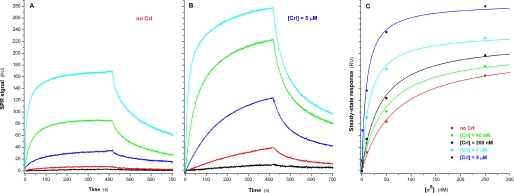
FIGURE 2.
Binding of σS to immobilized E. Association and dissociation real time profiles are shown for the following σS concentrations: 0.4 nm (black), 2 nm (red), 10 nm (blue), 50 nm (green), and 250 nm (cyan). A, in the absence of Crl. B, in the presence of 5 μm Crl. C, plot representing the steady-state responses as a function of σS concentration in the presence of five different Crl concentrations.

