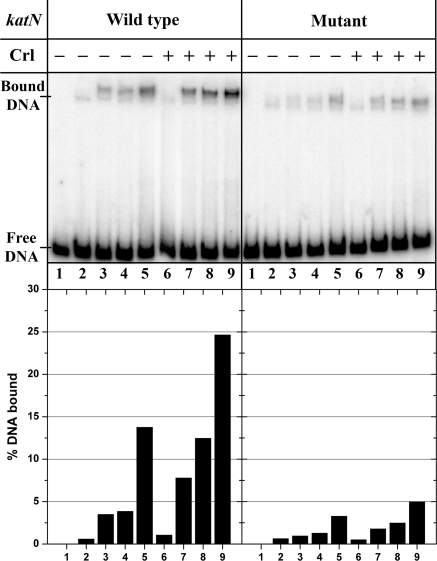
FIGURE 5.
Band shift analysis of E and EσS binding to wild type (left) or mutant (right) katN-labeled fragments in the presence (lanes 6–9) or absence of Crl (lanes 2–5) at 8 nmE and [σS] = 0(lanes 2 and 6), 8 nm (lanes 3 and 7), 40 nm (lanes 4 and 8), and 1 μm (lanes 5 and 9); lane 1, no protein. A typical autoradiogram is shown. The bands corresponding to free and bound DNAs are indicated, and the percentage of bound DNA is quantified in the histogram below each lane.

