
Figure 1.
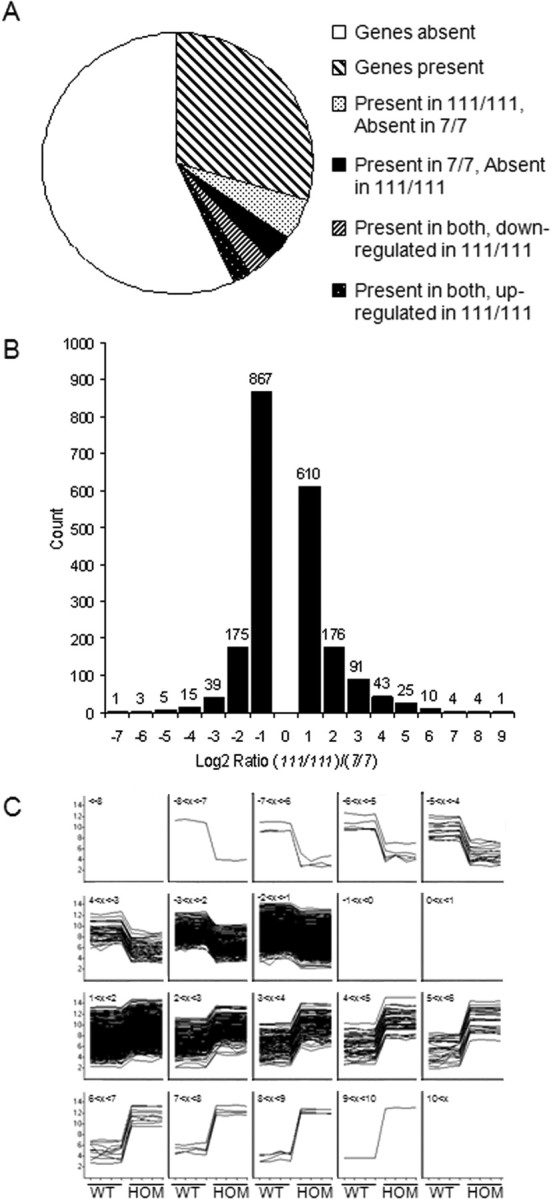
mRNA expression profiling reveals gene expression responses to wild-type (WT) or mutant Htt. Comparison of mRNA expression profiles yields numbers of genes present and absent in wild-type STHdh7/7 compared with mutant STHdh111/111 cell lines. A, Pie chart showing the distribution of the present and absent probes. Probes called present were present or marginal in at least three of the four replicates, probes called absent were absent in at least three of four replicates, and probes were called marginal if present and absent in two of the four replicates. More probes were present in STHdh111/111 and absent/marginal in STHdh7/7. B, Distribution of the binned log2(STHdh111/111/STHdh7/7) from the probes called present in both cell lines, with a log2 ratio >1 or less than −1 and a p value <0.05. More probes were downregulated in the STHdh111/111 versus the STHdh7/7, but the amplitude of change (i.e., the difference in expression) was larger for the probes upregulated in the STHdh111/111 versus the STHdh7/7 lines. C, A representation of the log2-normalized intensities for each replicate clustered by the log2 ratio bins determined from the probes called present in both cell lines, with a log2 ratio >1 or less than −1 and a p value <0.05, demonstrating the consistency of the results between the four replicates of each group and the amplitude of the differences between the two groups. The title of each box identifies which of the homozygote (HOM)/wild-type binned data are shown from −7 (top left) to +9 (bottom right). The y-axis shows the magnitude of change for each sample, whereas the x-axis labels identify the wild-type (first four, left) and homozygote (last four, right) samples for each box. Thus, within each bin, the traces represent the fold change in wild-type cells to homozygote cells.