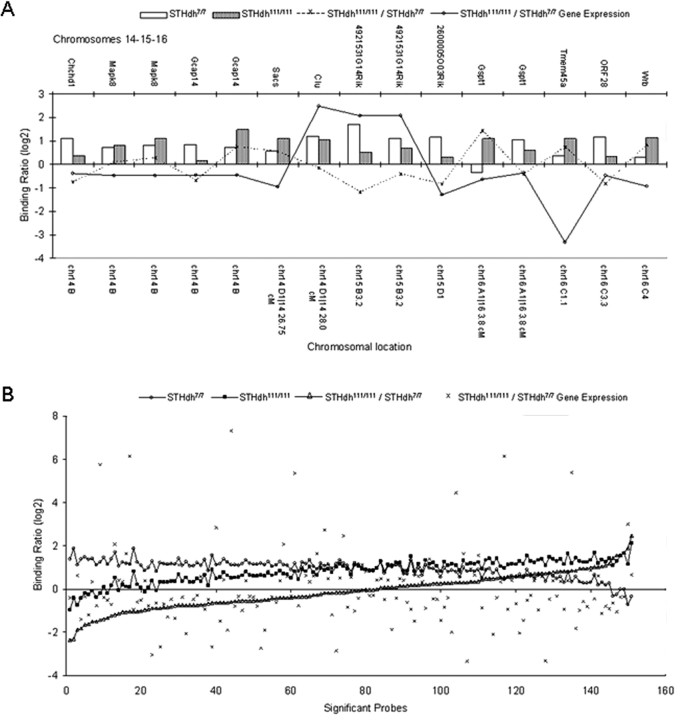
Figure 5.
No correlation between ChIP-on-chip data and mRNA expression profiling. A, ChIP-on-chip binding ratios (dashed line) for STHdh7/7 (open bars) and STHdh111/111 (filled bars) do not show a straightforward correlation with mRNA expression level changes (solid line) on a gene-by-gene basis: shown are representative combined data from ChIP-on-chip and gene expression studies for significant genes on chromosomes 14, 15, and 16. B, ChIP-on-chip binding ratios (open triangles, ranked in order) and gene expression profiles (crosses) show no correlation at a global level. Also plotted are STHdh7/7 (open circles) and STHdh111/111 (filled squares) binding ratios.

