
Figure 3. Quantification of the dynamics of EGF and Tf binding, internalization and co-localization.
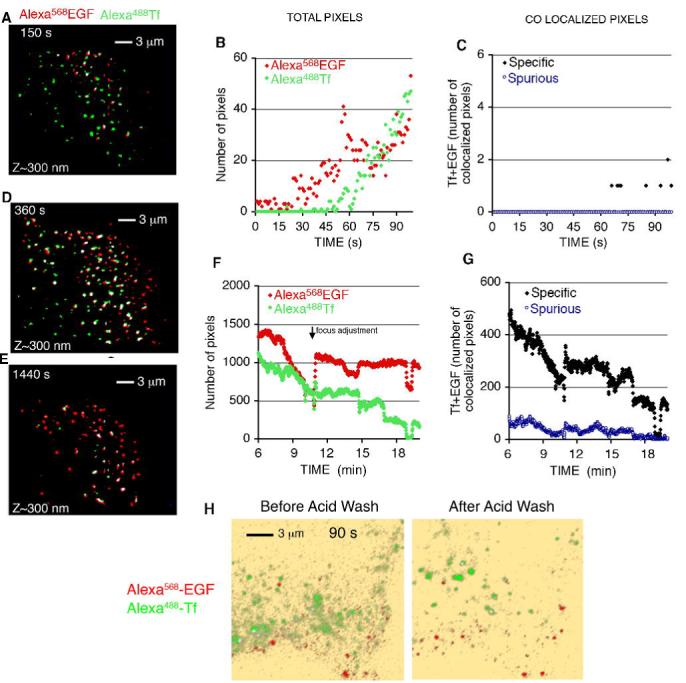
COS-7 cells grown on coverslips were placed in KRH buffer at 35°C, and exposed to 50 ng/ml Alexa568-EGF and 20 μg/ml Alexa488-Tf. Image capture was started immediately after ligand addition, with the incident angle of the laser set to visualize ∼100 nm from the coverslip. After 2 min, cells were washed twice with KRH and the incident angle modified to visualize ∼300 nm into the cell. Masked, overlapped images from several time points are shown in A,D and E. The number of total pixels of each fluorophore (B,F), as well as the number of co-localized pixels (C,G) seen at early time points after ligand addition (B,C), and after the wash step (F,G) are plotted over time after ligand addition. Results are from a single image set which is representative of a minimum of 5 independent experiments. H. Cells were exposed to ligands for 90 s, imaged, washed in cold PBS, exposed to an acid wash solution consisting of PBS containing 50 mM sodium acetate pH 4.0 for 3 min, and re-imaged.