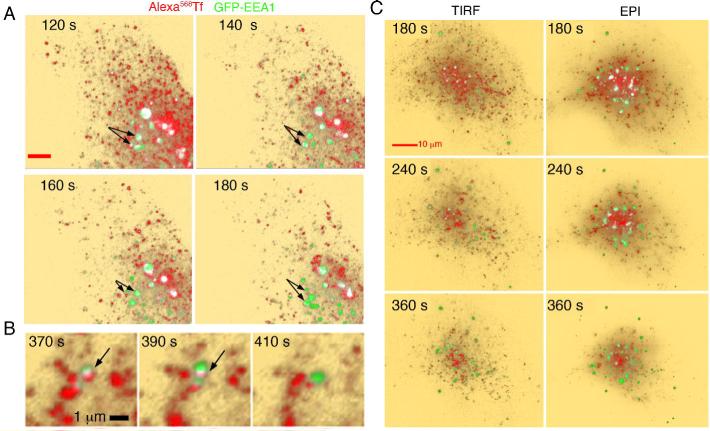
Figure 5. Imaging of Tf and EEA1.
A. COS-7 cells expressing GFP-EEA1 (green) were exposed to 10 μg/ml Alexa568-Tf (red) for the times indicated in each panel. After 60 s cells were washed, incubated with 200μg/ml unlabeled Tf, and imaged by TIRF-M with an incident angle set to visualize 300 nm from the coverslip. Co-localized voxels are depicted in white. B. Higher resolution series depicting the transient nature of the co-localization of Tf with EEA1. C. TIRF images were obtained at 0.5 Hz, and at 60 s intervals illumination was switched to epifluorescence for the acquisition of optical sections at 250 nm intervals through the entire cell volume. Shown is the TIRF image preceding the acquisition of the image stack. Optical sections were projected into a single 2D image.

