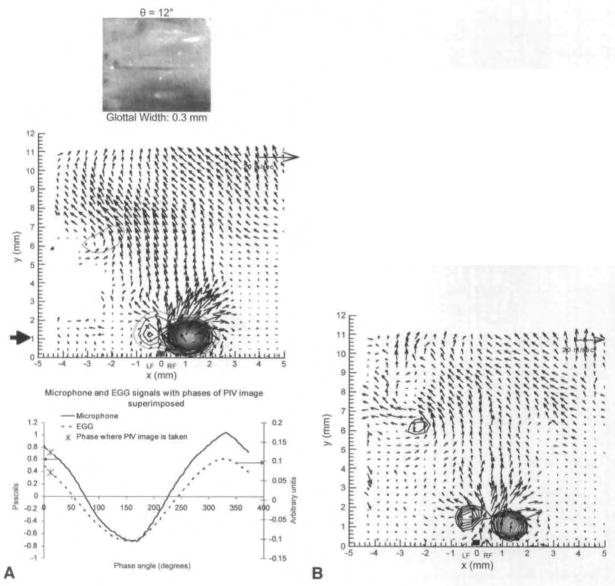
Fig 3.
A) Averaged PIV velocity field for phase 12°, which is at beginning of opening. High-speed visualization of vocal folds from above is shown on top. Bold line on x-axis indicates position and width of glottal gap at mid-membranous points at this phase. Time this field was taken is marked on both eleclro-gloltography (EGG) and microphone signals, which are seen on bottom. Strong vortex is seen above right fold (RF), and weaker one above left fold (LF), B) Instantaneous PIV field for 12°. This is 1 of 10 fields that are averaged to produce field seen in A.

