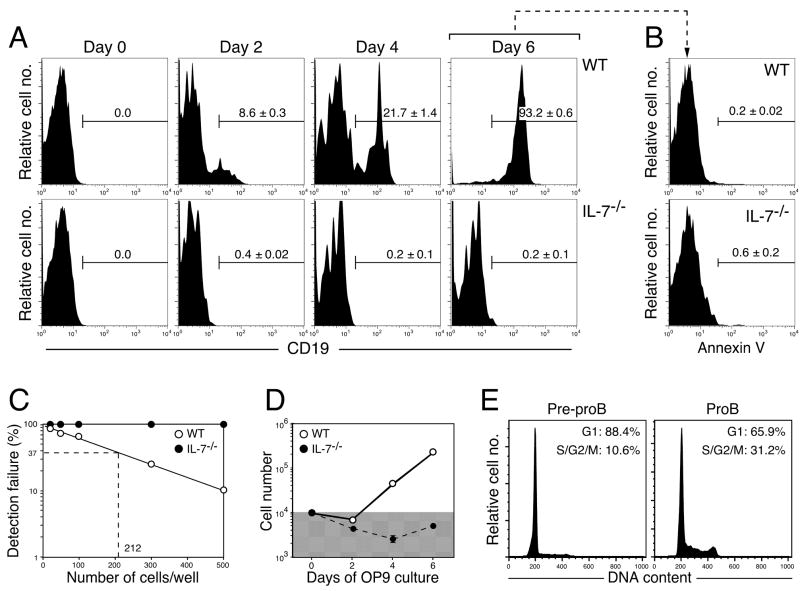
Figure 3. B cell potential of IL-7−/− pre-proB cells in in vitro stromal cell cultures.(A).
Pre-proB cells (1.0×10⁴ cells/well) derived from WT (upper panels) and IL-7−/− mice (lower panels) were cultured on OP9 stromal cells in the presence of IL-7, SCF, and Flt3L for the period shown in the figures. Representative FACS plots from two independent experiments were shown. The mean ± S.D. from more than 6 samples from various time points was indicated in the FACS plots. CD19+ cells in the plots represent proB cells. (B) Apoptotic cells were examined by annexin V staining at 6 days after culture. Stromal cells were excluded by scatter gates. PI exclusion was not done in this assay. (C) The frequency of cells that can give rise to proB cells in the pre-proB population in WT and IL-7−/− pre-proB cells. Indicated numbers of pre-proB cells from either WT (open circle) or IL-7−/− pre-proB cells (closed circle) were cultured in 96 well plates as described in the legend for Figure 2A. Wells containing B220+CD19+ cells were counted as a positive well. We did not observe any CD19+ proB cells from IL-7−/− pre-proB cells even at 1.0×10³ cells/well, where all wells seeded with WT pre-proB cells contained proB cells (the limiting number: 1 in 212). (D) Cell numbers in the culture of pre-proB cells. Cell numbers in the culture shown in Figure 2A were counted with a hemocytometer under the microscope. OP9 stromal cells were excluded from the counting based on the difference in cell size. The shaded area in the graph indicates the numbers below the input cell number (1×10⁴). (E) Cell cycle status of pre-proB and proB cells in WT mice was analyzed on FACS.

