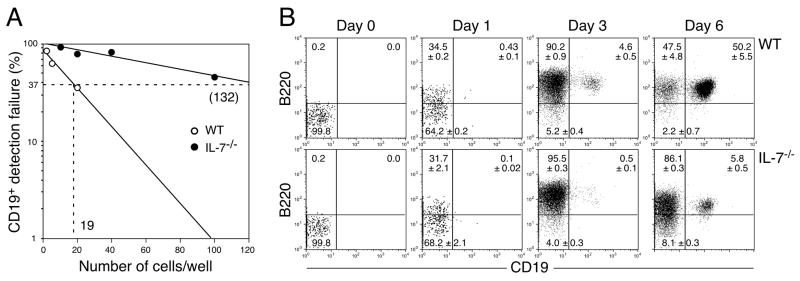
Figure 5. B cell potential of IL-7−/− CLPs.
in vitro. (A) The frequency of cells that give rise to CD19+ proB cells in the CLP population derived from WT and IL- 7−/− mice. Various numbers of CLPs from WT and IL-7−/− mice were plated in wells of 96 well plates and cultured as described in Figure 2A. Wells containing B220+CD19+ cells were counted as a positive well. The limiting numbers in this assay are 1 in 19 for WT pre-proB cells and 1 in 132 for IL-7−/− pre-proB cells. (B) The kinetic analysis of B cell development from WT or IL-7−/− CLPs. CLPs (2×10³ cells/well) from either WT or IL-7−/− mice were cultured as described in Figure 3A. In the plots, B220−CD19−, B220+CD19−, and B220+CD19+ cells are CLP, pre-proB, and proB cells, respectively. The period of time in the culture is indicated at the top of the FACS plots. Reanalysis of freshly isolated CLPs before culture was shown as day 0. The mean percentage ± S.D. from more than 6 samples from 2 independent experiments was indicated in the FACS plots.

