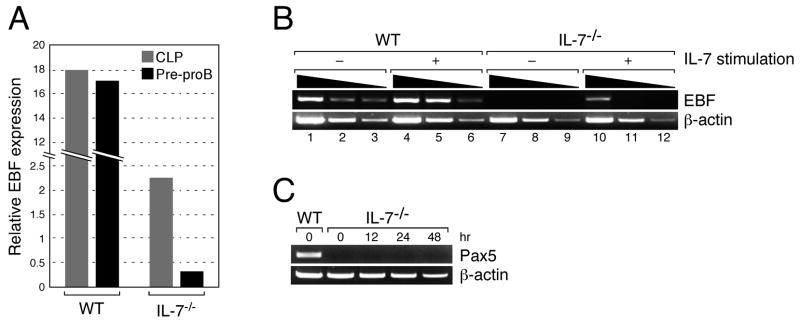
Figure 6. EBF expression level in WT and IL-7−/− pre-proB cells.
(A) EBF expression in the CLP (grey bar) and pre-proB (black bar) populations derived from WT or IL-7−/− mice was examined by quantitative PCR. EBF expression in whole BM was arbitrary defined as unit one and the mean value of three independent samples is shown. The same results were obtained by two independent experiments. (B) EBF expression in WT and IL-7−/− pre-proB cells (2.0×10⁴) was examined before and after IL-7 stimulation by semi-quantitative PCR. After RNA purification and first strand synthesis, cDNAs were serially diluted by 5-fold and subjected to PCR. ProB cell markers such as CD19 and BP-1 were not upregulated during the culture (17). (C) Pax5 expression in IL-7−/−pre-proB cells after IL-7 stimulation. IL-7−/− pre-proB cells were stimulated with IL-7 as described above for the period indicated in the figure. Pax5 expression in each sample was measured by RT-PCR. β-actin expression was also examined as a loading control. WT pre-proB cells were used as a positive control for Pax5.

