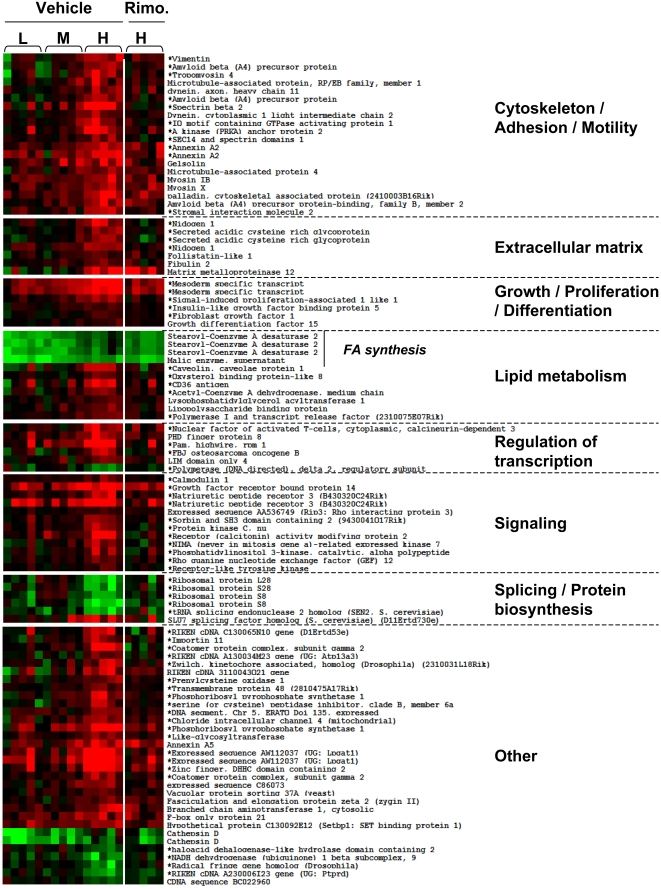
Figure 7. Gene whose expression was correlated with body weight in VAT and their correction by rimonabant treatment.
The genes that were selected by linear regression analysis for positive or negative correlation with body weight were classified according to biological function categories and their expression level was displayed for each mouse with red: increased expression, green: decreased expression as compared to NC fed mice. * indicates genes whose expression was significantly regulated by rimonabant in the H group.

