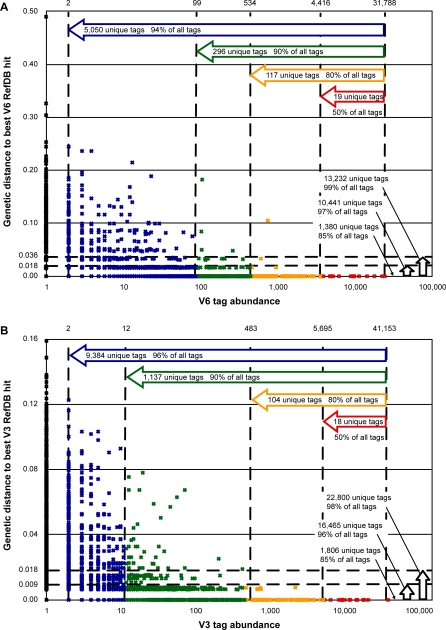
Figure 1. Genetic Distances between Tags and Reference Sequences.
The genetic distances between each unique V6 tag (A) and V3 tag (B) and its best hit (or hits) in the appropriate reference database is shown on the vertical axis (see Methods for details); the abundance of the tag is shown on a logarithmic scale on the horizontal axis. Horizontal arrows indicate cumulative totals of tags from most to least abundant. Discrete horizontal rows of symbols near the x-axis correspond to an integer number of nucleotide changes relative to a reference sequence; vertical arrows indicate cumulative tag totals for up to 0, 1, or 2 changes. Abundant tags are likely to be identical to sequences in the reference databases; rare tags display a range of distances.

