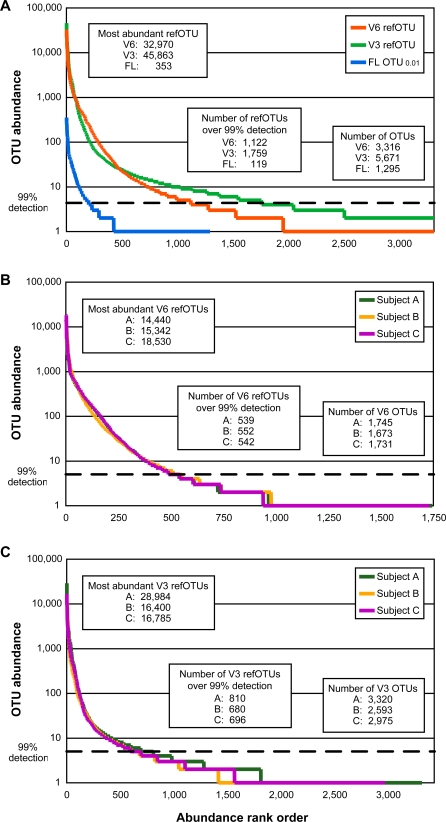
Figure 2. Rank Abundance Curves.
OTU abundance is shown on a logarithmic scale on the vertical axis; OTUs (defined as described in Methods) are listed in rank order along the horizontal axis. The dashed horizontal line at abundance 5 corresponds to an estimated probability of detection of 99%, based on the appearance of a rare OTU in a tag or sequence library according to the Poisson distribution. A comparison of V6, V3, and full-length libraries is shown in (A); the abundance per subject for V6 and V3 refOTUs are shown in (B and C). The maximum V3 refOTU abundance and number of V3 refOTUs are higher for individual A than other participants (C) because three additional samples were analyzed for this subject.

