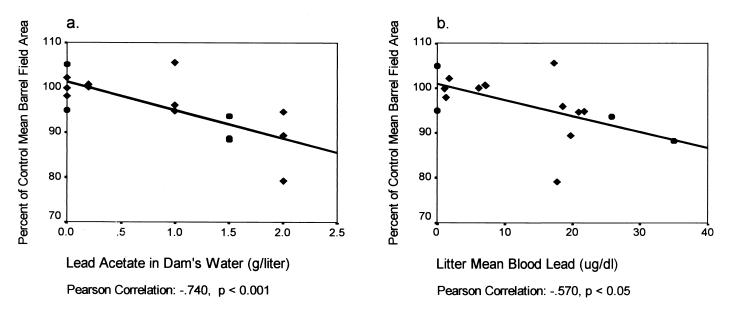
Figure 3.
(a) Reduction in barrel field area with increasing neonatal lead exposure. (b) Reduction in barrel field area with increasing blood lead concentration. Each point represents the mean of three rats examined per litter, normalized as percentage of the control mean for that experiment. ●, experiment 1; ⧫, experiment 2.

