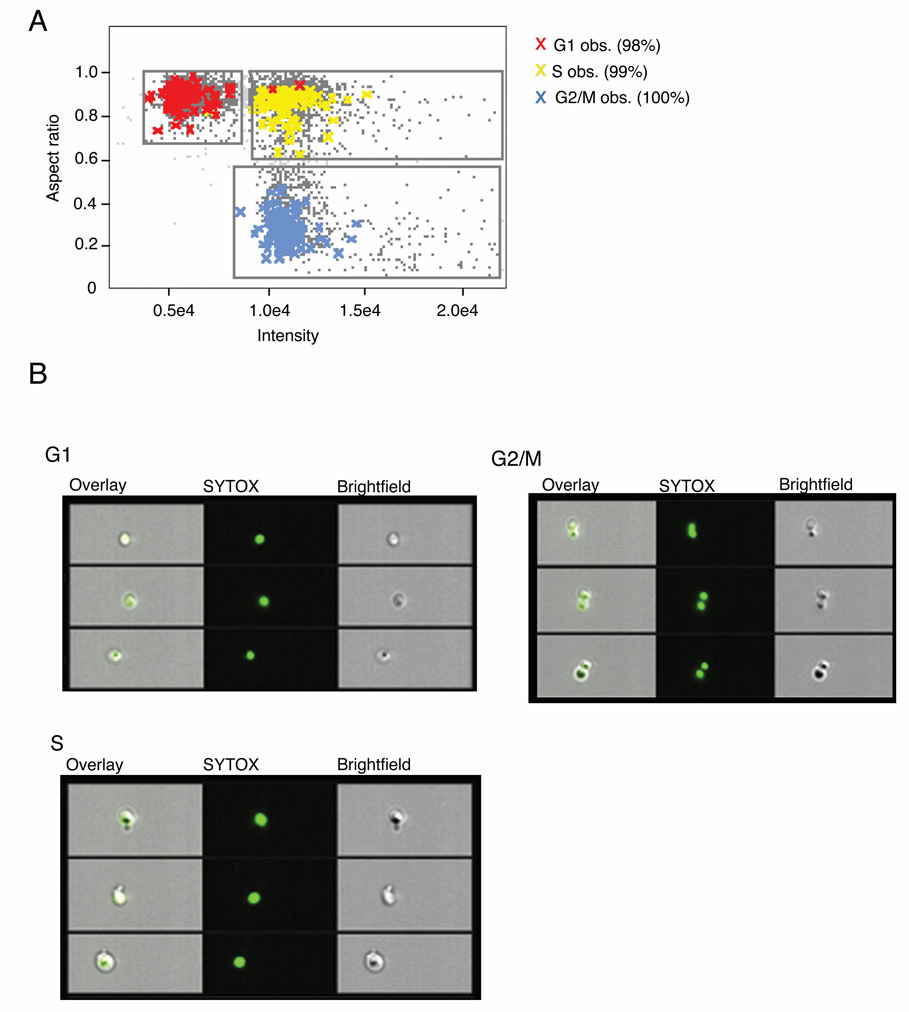
Figure 3.
Cell cycle analysis of S.cerevisiae by Multispectral Imaging Flow Cytometry (MIFC). Unsynchronized wild type yeast cultures were fixed and treated with SYTOX green DNA stain. Images of 10,000 cells were collected simultaneously in brightfield and SYTOX green channels. A: A bivariate plot of the aspect ratio and fluorescence intensity from the SYTOX green channel was generated from the in-focus population. Three spontaneously segregating regions were identified and gated. From the gathered images, 100 G1, S or G2/M cells were visually identified (as indicated by colored crosses) and the tagged populations were overlaid on the original plot. B: Images from within each region were chosen at random. From left to right the overlaid images, SYTOX and brightfield channels are displayed.

