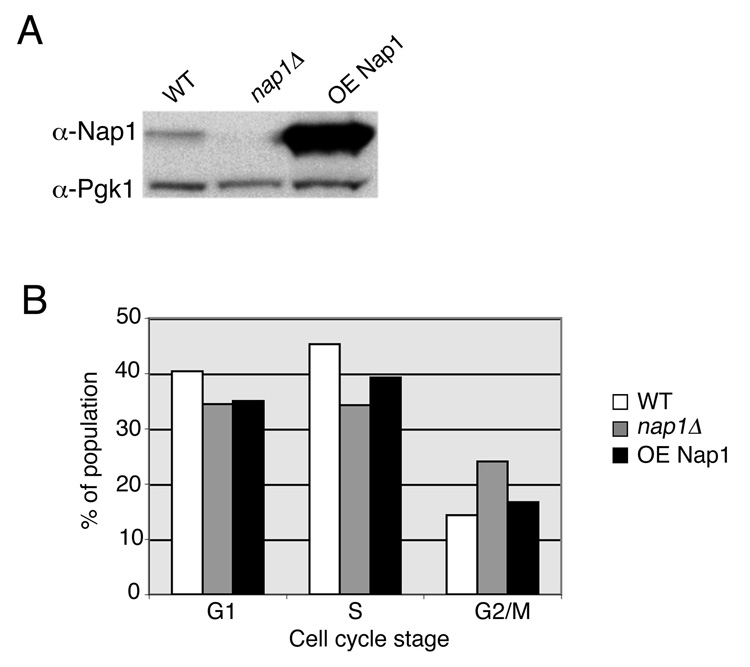
Figure 5.
Budding yeast cell cycle distribution is dependent upon NAP1 expression level. A: To determine the relative expression levels of NAP1, whole cell lysates from the indicated strains were equalized and proteins were visualized by Western blotting with Nap1 or Pgk1 antibodies (WT, wild type; OE, overexpressed NAP1). B: Bar graph depicts the results from cell cycle profiles analyzed by MIFC from each of the three indicated strains. Bars indicate the percentage of the population determined to occupy each stage of the cell cycle. 10,000 cells from each sample were analyzed.

