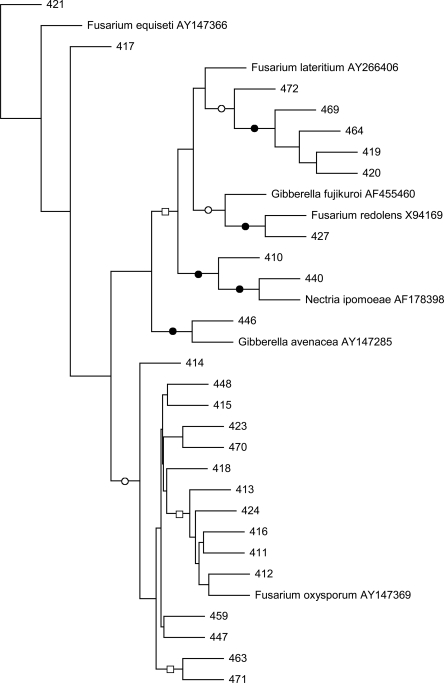
Fig. 1.
Maximum likelihood phylogram of fungal rRNA-ITS nucleotide sequences. Branch points supported by maximum likelihood and maximum parsimony analyses are indicated: bootstrap values ≥89% (filled circles), bootstrap values between 55 and 83% (open circles). All other branch points had less than 50% bootstrap support. This is an unrooted tree. The scale bar indicates the number of nucleotide substitutions per position.

