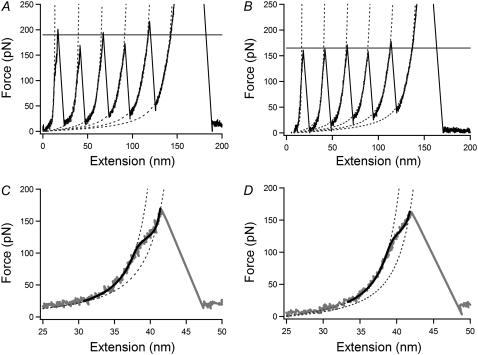
FIGURE 2.
Force-extension curve of (C47S, C63S I27)5 at 2 (A and C) and 30°C (B and D) at an extension speed of 50 nm/s. (A and B) The characteristic sawtooth pattern in which there are five unfolding peaks. The dotted lines are fits using a conventional WLC model. The horizontal line represents the average of the five unfolding peak forces. (C and D) Enlargement of the second unfolding event in (A and B) showing the hump-like deviation. Dotted lines show a standard WLC fit to the force extension profile before and after detachment of strand A. The black line is a fit to the two-state WLC model.

