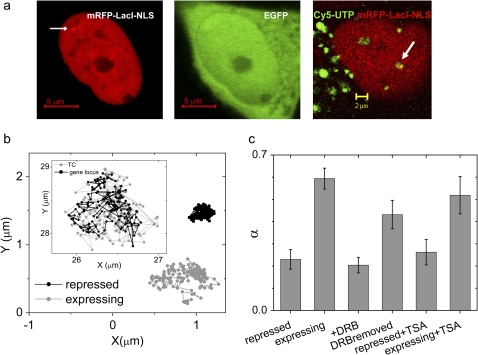
FIGURE 5.
Nature of gene loci mobility: (a) Image of HeLa cell expressing mRFP-lacI-NLS (left panel) and EGFP (middle panel). Scale bar: 5 μm. Arrow indicates position of the EGFP gene locus. Right panel shows a cell where gene loci and TCs are labeled in red and green, respectively. Arrow indicates a colocalization of a gene locus and TCs. Scale bar: 2 μm (b) typical trajectories measured for cells expressing EGFP and under repression. (Inset) Trajectories of a gene locus and TC. (c) Plot of mean α-values of gene loci under various conditions. Error bars correspond to standard error.

