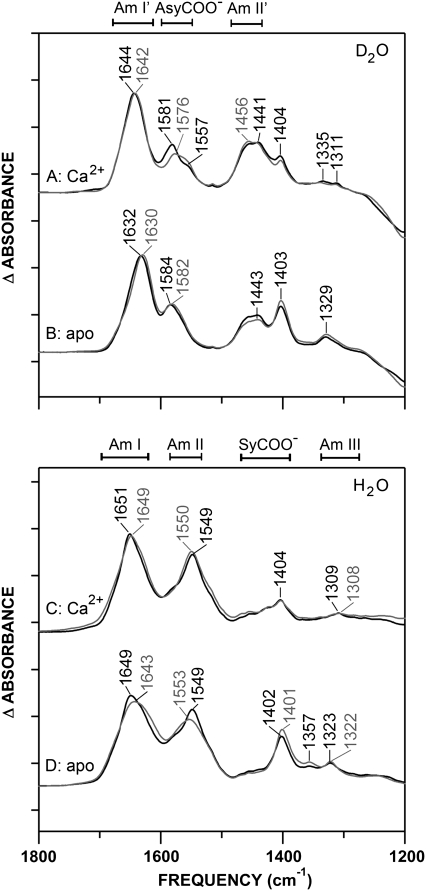
FIGURE 2.
The FTIR absorbance spectra of CaM (black) and CaMox (gray) (10 mg/mL). Positions of major bands in D2O (A and B) and H2O (C and D) and their maxima (cm−1) are indicated. Spectra were acquired in Tris buffer, pH/pD 7.5, at room temperature. Sample buffer contained 10 mM CaCl2 (A and C), or samples were depleted of metals using EGTA/EDTA (B and D). Spectra were buffer-subtracted and normalized to a constant amide I/I′ band area, as described in Experimental Procedures. Tick marks on y axis represent Δ0.2 absorbance units.

