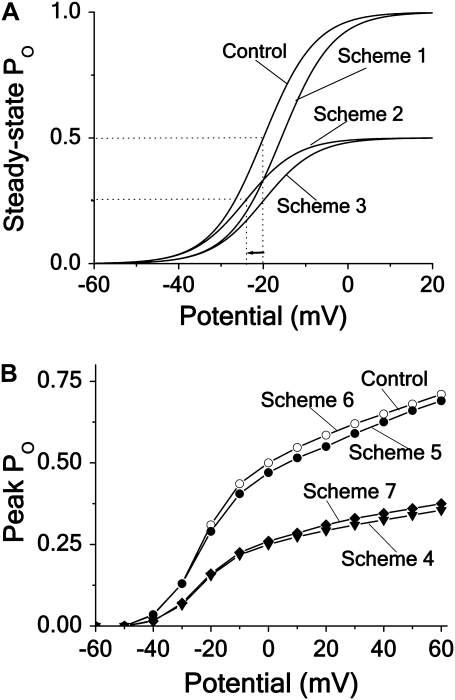
FIGURE 3.
Effects of different block mechanisms on activation curves. Computed steady-state and peak open probability (PO) plotted against potential for the different blocking schemes (see Figs. 1 and 2), assuming Kd concentration and intermediate blocking rate. (A) Noninactivating channels, Schemes 1–3 (see Appendix A). (B) Inactivating channels, Schemes 4–7.

