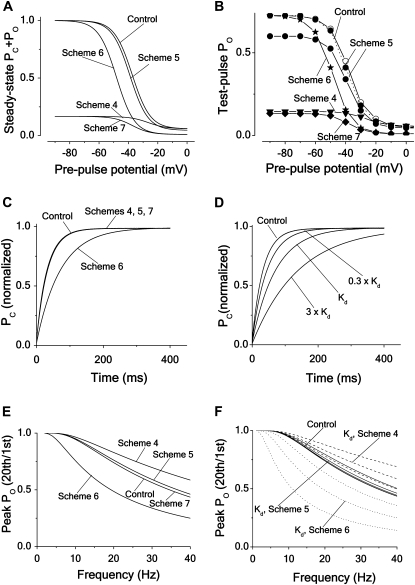
FIGURE 4.
Effects of different block mechanisms on steady-state inactivation, recovery from inactivation and frequency dependence. Computations for Schemes 4–7, assuming intermediate blocking rates. Except for panel A, all calculations were made with Eqs. 3–5, using the parameter values for Shaker in Table 1. (A) Steady-state inactivation curves according to the expressions in Appendix A, assuming a blocker concentration of 5 × Kd. (B) Steady-state inactivation curves for the same cases as in A, but given as effect on the peak PO, associated with a test step to +20 mV. (C) Recovery time course of PC at −80 mV after a pulse step to +20 mV for the same cases as in A and B, but assuming a blocker concentration of Kd. (D) Recovery time course of PC for Scheme 6 at three concentrations (0.3 × Kd, Kd, and 3 × Kd). Same protocol and parameter values as in C. The recovery for Schemes 4, 5, and 7 was not affected by the altered concentrations. (E) Peak PO versus frequency curves, given as the ratio between peak PO at the 20th and the 1st step of a pulse train, consisting of 10 ms pulses to +20 mV from a holding potential of −80 mV, plotted against frequency. (F) Peak PO versus frequency curves at the concentrations 0.3 × Kd, Kd, and 3 × Kd. Same protocol and parameter values as in E. Control (thick continuous line), Scheme 4 (dashed lines, highest concentration at top); Scheme 5 (thin continuous lines, highest concentration at top) and Scheme 6 (dotted lines, lowest concentration at top).

