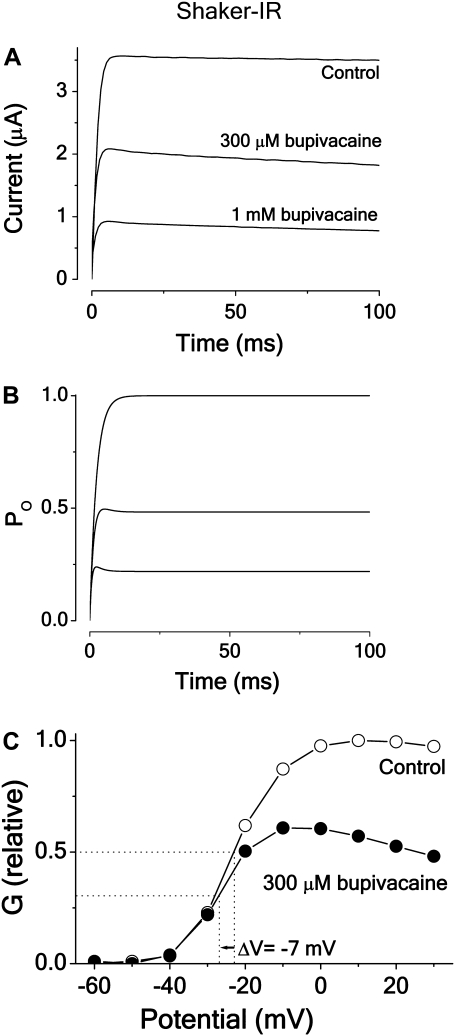
FIGURE 7.
Effect of bupivacaine on current time course and G(V) curve of Shaker-IR. (A) Currents evoked from a voltage step to +20 mV from a holding potential of −80 mV in 300 μM and 1 mM bupivacaine (•) and in control (○) solution. (B) Computed time course of the open probability (PO) of Scheme 2, using activation value and binding rates listed in Table 2. (C) Corresponding steady-state G(V) curves measured at t = 20 ms (Eq. 2). Same experiment as in panel A.

