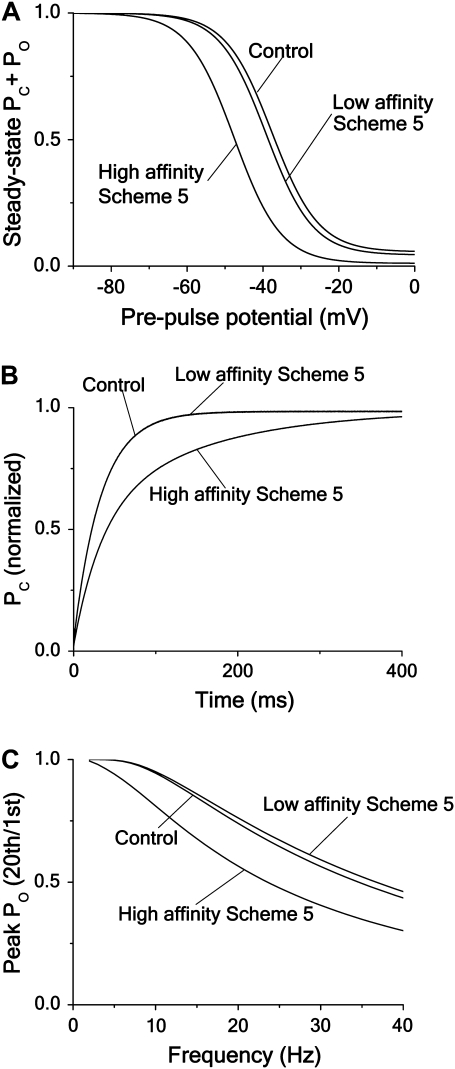
FIGURE 9.
Effect of increasing the affinity of an open-state blocker. Computations showing how a open-state block (Scheme 5) can mimic an inactivated-state block (Scheme 6). The same parameter values as for corresponding curves in Fig. 4 are used for demonstrating low-affinity block, while the high-affinity curves are computed with an unblocking rate of λ = 0.1/15 ms−1. (A). Steady-state inactivation curves (same protocol as in Fig. 4 A). The shifts are −2 and −12 mV, respectively. (B) Time course of recovery from inactivation (same protocol as in Fig. 4 C). The half-time values are 22 ms and 44 ms, respectively. (C) Frequency dependence curve (same stimulation protocol as in Fig. 4 E).

