FIGURE 2.
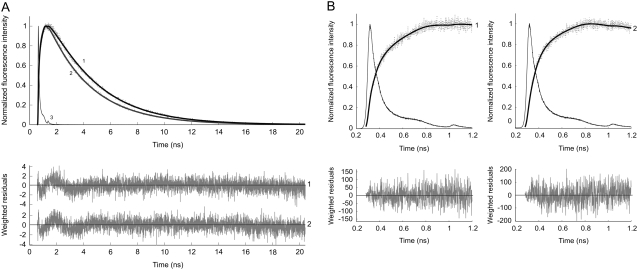
Normalized experimental (dotted line) and fitted (solid line) fluorescence rise and decay curves of the Venus acceptor, detected at 557 nm, in YC3.60 on donor excitation at 400 nm. In A the data are presented with a time scale of 5 ps/channel, whereas this is 1 ps/channel in B, in which only the first nanosecond is shown. Curve 1 is the fluorescence intensity trace of YC3.60 in the absence of Ca2+, whereas curve 2 is that of YC3.60 in the presence of Ca2+. Curve 3 represents the reference compound xanthione in ethanol. In B it can be observed that the rise time of curve 2 is shorter than that of curve 1, because curve 2 is already starting to decay. The experimental data taken at both time scales are globally analyzed using a bi-exponential rise (in case of calcium-free YC3.60) and mono-exponential decay model with amplitudes αi and lifetimes τi as adjustable parameters for obtaining an optimal fit. The recovered parameters (α, τ) are collected in Table 1 (case 3). Weighted residuals are presented in the bottom panels. Global χ2 values are, respectively, for YC3.60 in absence of Ca2+ 1.05, and for YC3.60 in presence of Ca2+ 1.05.

