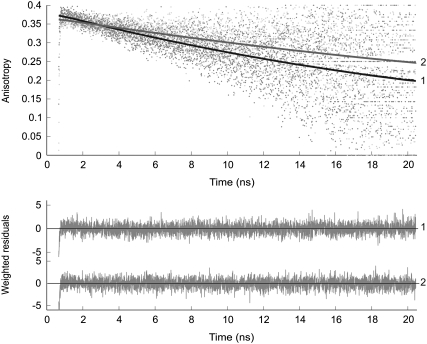
FIGURE 4.
Experimental (dotted line) and fitted (solid line) fluorescence anisotropy decays of YC3.60 on excitation (492 nm) and detection (557 nm) of the Venus moiety in absence of Ca2+ (curve 1) and in presence of Ca2+ (curve 2). The decay model is a mono-exponential function yielding the anisotropy at time zero, r(0) = r0, and rotational correlation time that are presented in Table 2. Weighted residuals are presented in the bottom panel. Global χ2 values are, respectively, for YC3.60 in absence of Ca2+ 1.06, and for YC3.60 in presence of Ca2+ 1.09.

