FIGURE 5.
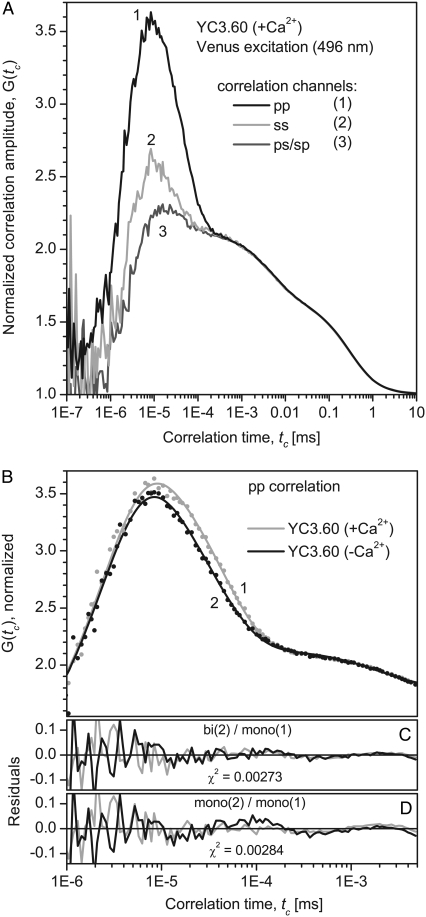
Experimental and fitted fluorescence correlation curves of YC3.60 after excitation and detection of the acceptor (λex 496 nm, λdet 510–556 nm). The curves are normalized at tc = 1.2 μs. (A) Correlation curves for YC3.60 in presence of Ca2+. Three different combinations of polarizations are presented: autocorrelation of the fluorescence polarized parallel to the excitation polarization (pp, curve 1), perpendicular to the excitation (ss, curve 2), and cross correlation of both polarizations (ps and sp, curve 3). Only the polarization dependent part of the correlation curves can be assigned to rotational diffusion. The measurement time was 14 min. (B) pp-correlation curves of YC3.60 in presence of Ca2+ (curve 1) are compared to YC3.60 in absence of Ca2+ (curve 2). The rotational part of curve 1 (+Ca2+) can be reproduced well by a single exponential, whereas curve 2 (−Ca2+) shows significant deviations and exhibits a second decay time. Fit parameters are presented in Table 3. (C) Residuals for the global fit with: (YC3.60(+Ca2+): 3 exponentials, YC3.60(−Ca2+): 4 exp.). (D) For comparison residuals for the global fit with: YC3.60(±Ca2+): 3 exp; i.e., a single independent rotational correlation time for each of the two curves (fit not shown).

