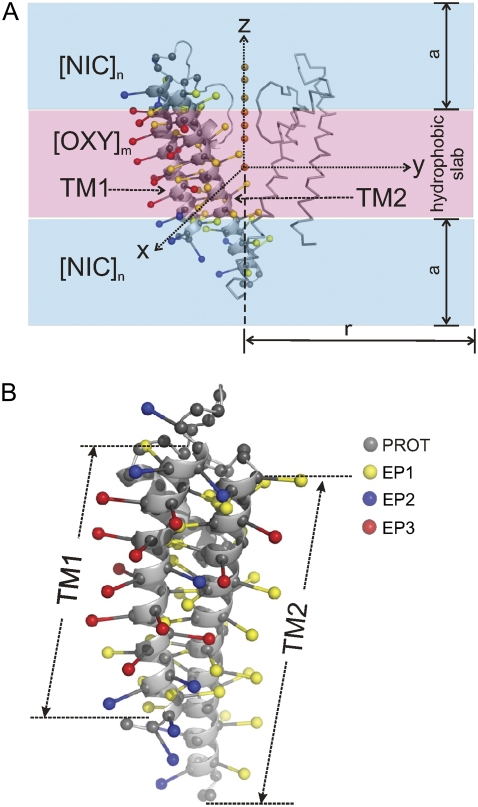
FIGURE 2.
System used for MD simulations and pseudoatom representations. (A) The KcsA x-ray structure (1k4c), an illustration of two subunits and a definition of restraining boundary for molecular oxygens (OXY) and Ni-EDDA complexes (NIC) for the simulations. Potassium ions are shown as orange spheres (B) the attachment of spin-label pseudoatom to protein backbone. The type of spin-labeled pseudoatom is color coded as EP1, yellow, EP2, blue, and EP3, red.

