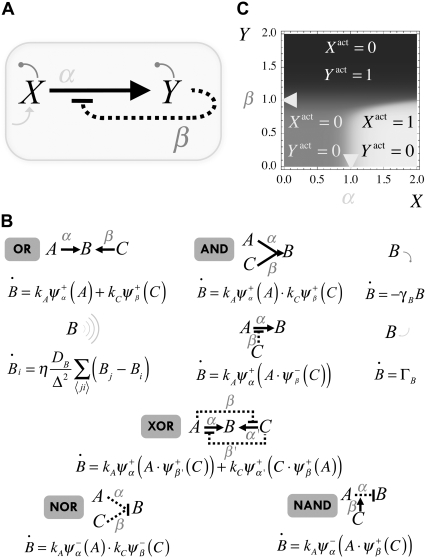
FIGURE 3.
(A) Single-cell protein network: X induces Y expression that in turn represses the activity of X. In addition, X is autonomously expressed and both species degrade. A mathematical representation of this and other networks, including that of Fig. 4, can be obtained by means of the rules shown in panel B. The correspondence between some interactions and logical functions has been also indicated in panel B. (C) Density plot of the relative activity, ΔXY = Xactivity – Yactivity, as a function of the expression levels of X and Y. The value of the cooperativity has been set to n = 10. The location of the thresholds (α = β = 1) is indicated by arrows. Three different regimes of activities are represented as a function of the expression levels: full X/null Y activities (white), null X/full Y activities (black), and null X/null Y activities (gray).

