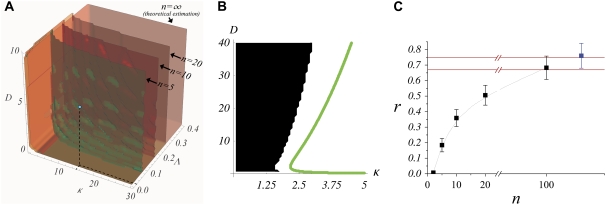
FIGURE 6.
(A) Phase diagram in the parameter space for boundary formation: numerical simulations and theoretical estimation. As a function of the parameters D, κ, and Λ the different surfaces (depending on the value of n) delimit the region that lead to a correct patterning for boundary formation (see text). The blue dot indicates the parameters used in numerical simulations in Fig. 7. (B) Detail of a D-κ cut of the phase diagram at the blue point highlighted in panel A (Λ = 0.02). (C) Robustness to parameter variation as a function of the cooperativity. Black/blue squares correspond to numerical simulations where Hill/Boolean regulatory functions were respectively used. Red solid lines stand for the bounds calculated analytically as n → ∞ (see Data S1 for calculation).

