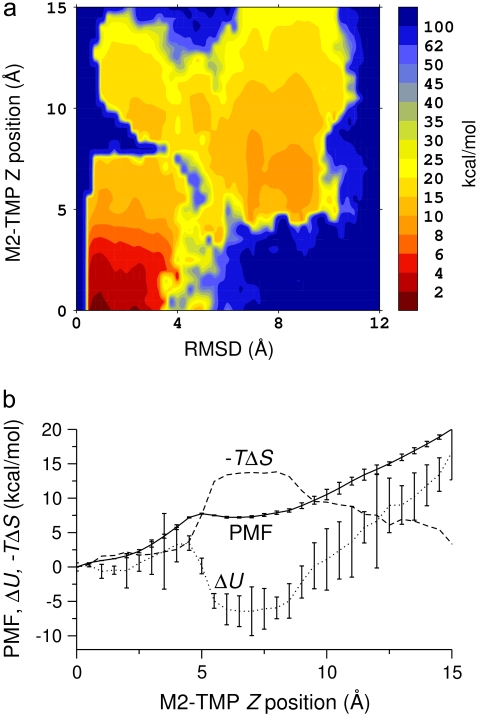
FIGURE 4.
PMF at 300 K of the M2-TMP calculated from REMD simulations combined with the center-of-mass Z-positional restraints. The peptide center-of-mass Z-position is restrained at various locations extending from the center of the membrane to the point where Z = 15 Å at 0.5-Å intervals. The final PMF surface is pieced together from restrained simulations by the WHAM analysis. (a) PMF surface as a function of the M2-TMP's Z-position and RMSD with respect to the experimental helical conformation. The overall global minimum is seen as the dark red area in the lower left-hand corner and corresponds to a helical conformation spanning the membrane with the appropriate experimental tilt angle. (b) 1D energy profiles obtained by averaging the 2D probability distributions over all RSMD values. The PMF profile as a function of the Z-position of the M2-TMP clearly shows the overall hydrophobic attraction of the solvated peptide to the membrane, but it also shows a barrier to full penetration into the membrane core. The averaged potential energy ( ) profile shows that the partially inserted trapped peptide is stabilized by the enthalpic component outside the membrane core, and that these states are more energetically favorable than a fully inserted peptide at Z = 0 Å. The entropic contribution (
 ) to the free-energy surface was calculated from the difference between the PMF and the ensemble average potential energy (PMF
  ). This graph clearly shows that the trapped states outside the membrane core are disfavored whereas the fully inserted peptide (which is experimentally observed) is favored. The statistical uncertainties in the PMF and the average potential energy profiles are twice the standard deviation estimated by the WHAM error analysis.

