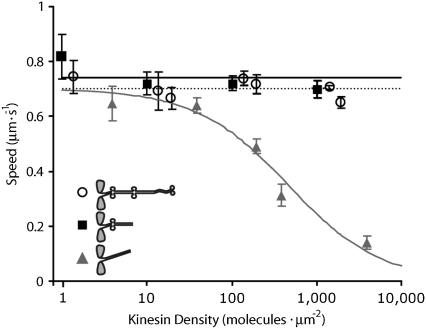
FIGURE 2.
Microtubule gliding speeds versus kinesin density. As kinesin density increases, gliding speed remains constant for full-length (open circles; dotted line shows average speed) and ΔT kinesin (solid squares; solid black line shows average speed), but decreases for construct ΔTΔH (solid triangles and solid gray line indicate Hill-type curve  where x0 = 460 and n = 0.8). Error bars are standard deviations.

