
Figure 1.
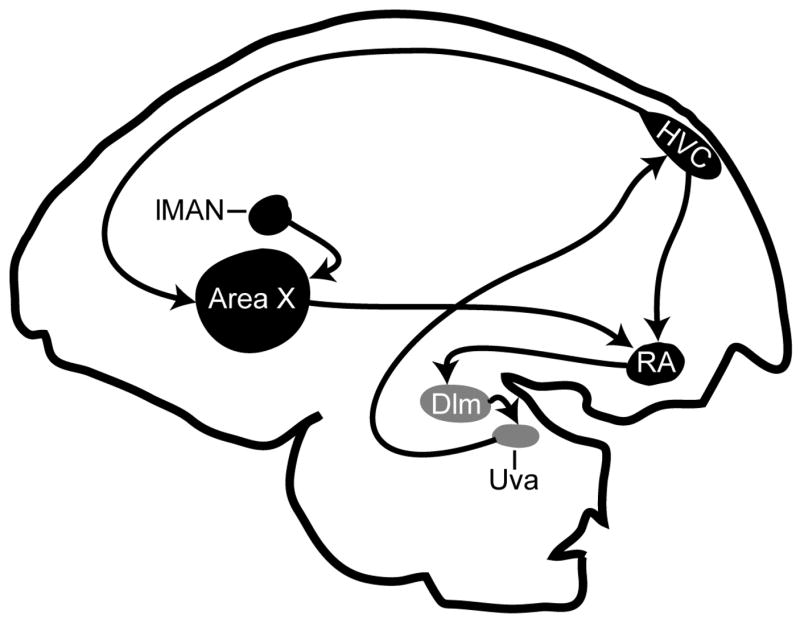
Parasagittal diagram of song regions with established distinct expression of CB1 receptors (adapted from (Soderstrom and Tian 2006). Rostral is left, dorsal top. Telencephalic regions containingdense CB1 expression are indicated in black and include telencephalic song regions lateral magnocellular nucleus of the anterior nidopallium (lMAN), Area X within songbird medial striatum (Area X), HVC and the robust nucleus of the arcopallium (RA). Thalamic regions nucleus uvaformis (Uva) and dorsal lateral nucleus of the medial thalamus (DLM) that also distinctly express CB1 receptors are shown in grey and included to illustrate known interconnections between song regions (indicated by arrows, (Bottjer and Johnson 1997).