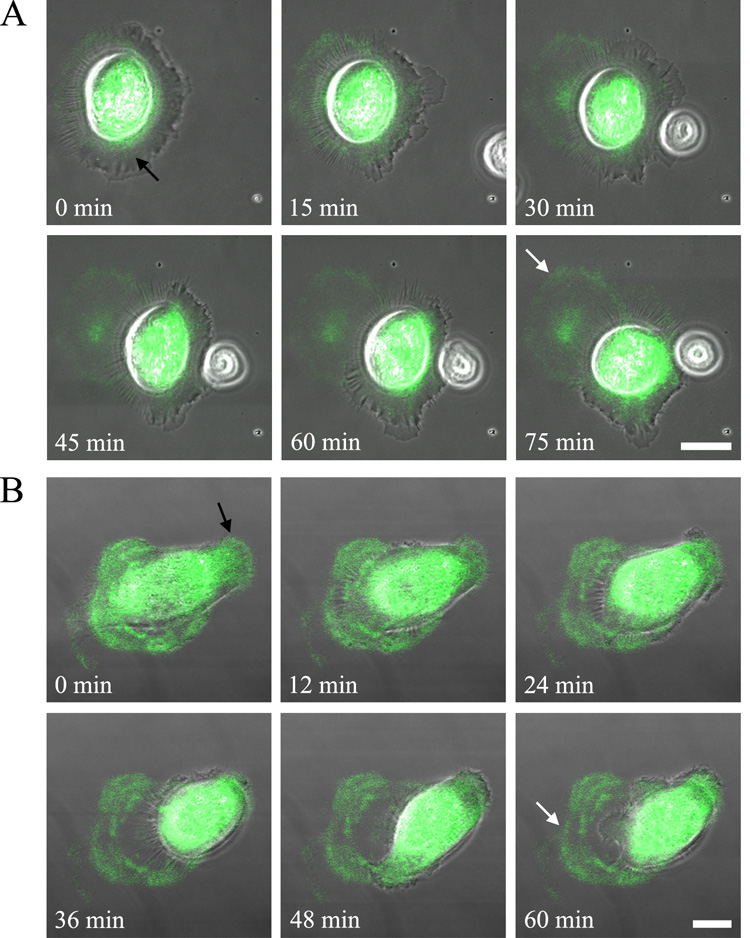
Fig. 5.
Live HEKs (A) or BEP2D cells (B) infected with virus encoding tagged β3 laminin were cells were plated onto glass coverslips and visualized 8 h later. Phase contrast and fluorescent images of the cells were then taken at either 5 min intervals for 75 min (A) or every 2 min for 60 min (B). Phase/fluorescence overlays at the indicated time points are shown. The black arrow in the first panel of each series of images indicates labeled protein towards the leading front of the moving cell while the white arrow in the last image of the series marks matrix left behind. The focal plane is close to the substratum-attached surface of the cells. Bars, 20µm.

