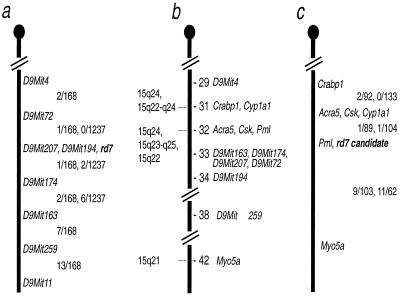
Figure 2.
Maps of the rd7 region of mouse Chr 9. (a) Mapping of the rd7 locus. The first fraction between the markers is the number of recombinants/total in the 77–2C2a-special-rd7/rd7 x CAST/Ei backcross, and the second fraction is the number of recombinants/total in the B6.Cg-rd7/rd7 X CAST/Ei intercross. (b) Composite map of mouse Chr 9 from the Encyclopedia of the Mouse Genome (www.informatics.jax.org/). The numbers to the right of the chromosome represent the cM distances from the centromere; the numbers to the left of the chromosome represent the chromosomal loci of the human orthologs of the mouse gene listed to the right. (c) Mapping of Pnr. The first fraction between the markers on the right is the number of recombinants/total from the cross (NFS/N X M. spretus) × M. spretus or C58/J, and the second fraction is the number of recombinants/total from the cross (NFS/N or C58/J X M. m. musculus) × M. m. musculus. Pml was typed only in the Mus spretus cross; Acra5 was typed only in the M. m. musculus cross.

