
Figure 3. GEE-derived models of estimated course of cognitive decline.
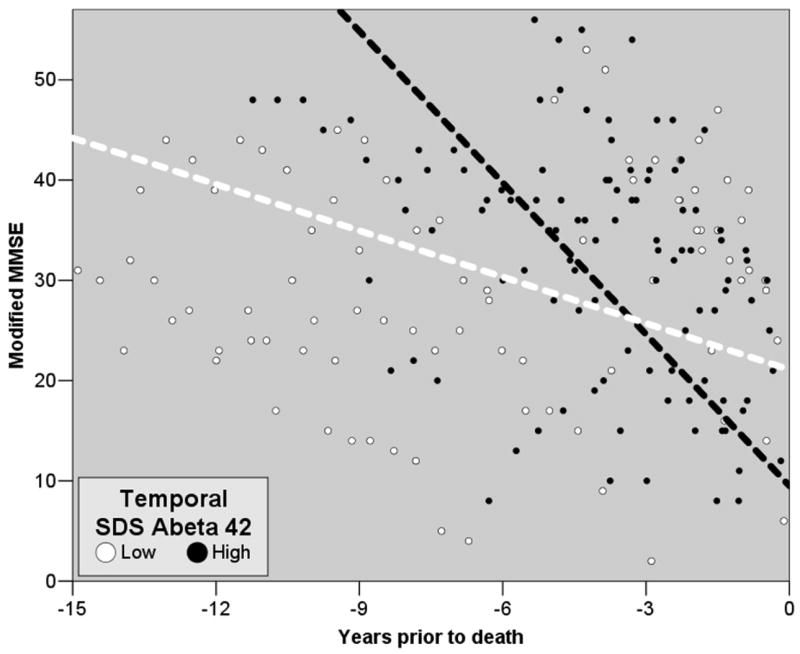
Lines depict the differential rate of decline in mMMSE scores prior to death as predicted by the GEE model for subjects whose SDS-extracted Aβ42 in temporal cortex was above (black) or below (white) the median. Circles represent subjects’ mMMSE scores at all times prior to death in the two groups. Note that the raw data are consonant with the GEE models.