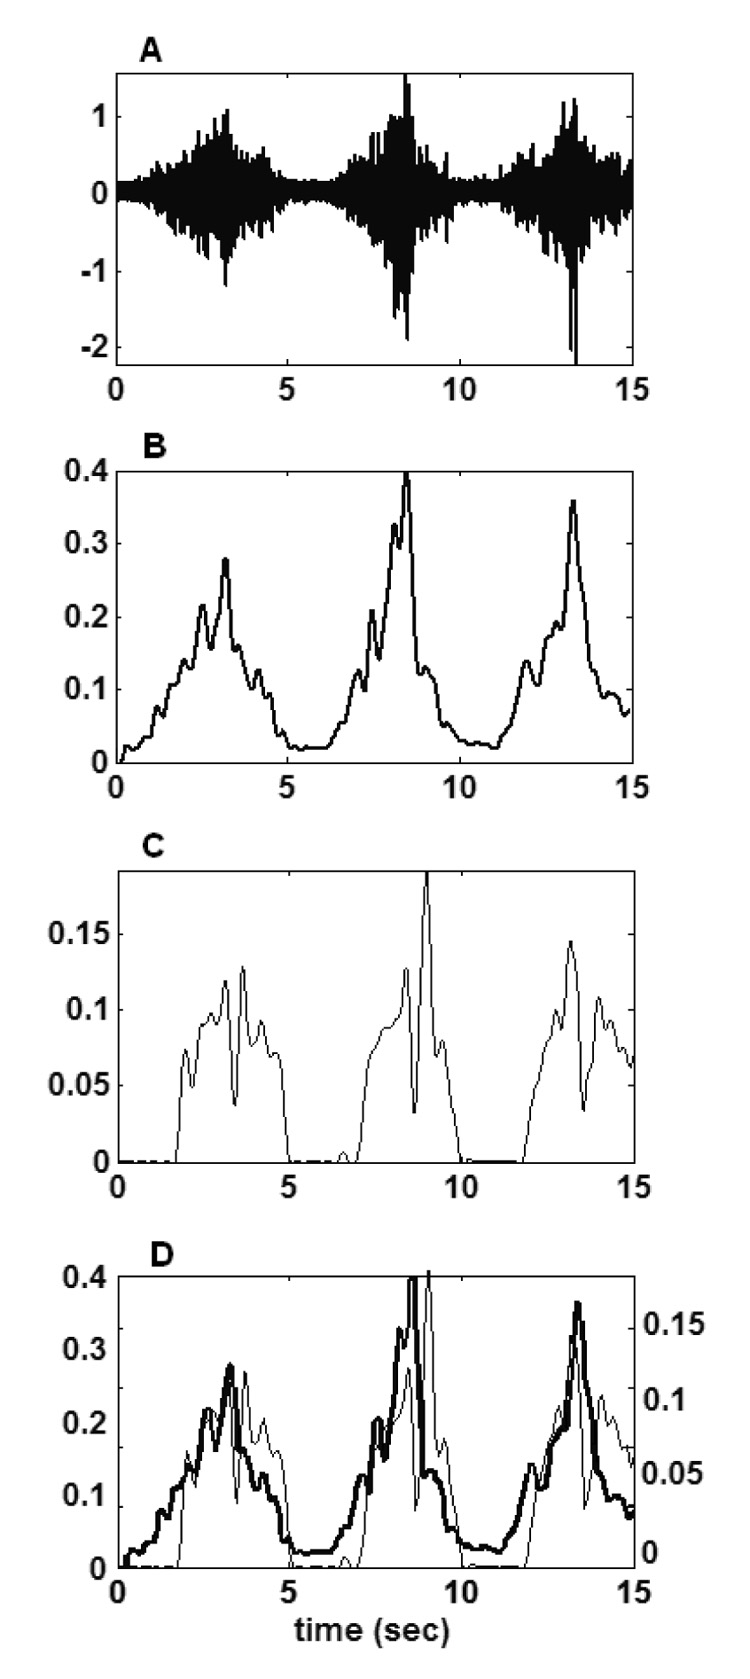
Figure 2.

EMG recording, processing, and comparison to model-predicted activations. For example, the EMG and model-predicted activations of middle deltoid muscle during a repeated humeral abduction movement are illustrated. Raw EMG (A), processed (rectified, low pass filtered at 4Hz and normalized) EMG (B), model-predicted activation (C), processed EMG (black line) and model-predicted activation (grey line) (D). For part D, the vertical axis for the EMG is on the left, and for the activation is on the right.
