
Figure 1. Map of the 2,000 km2 Serengeti study area.
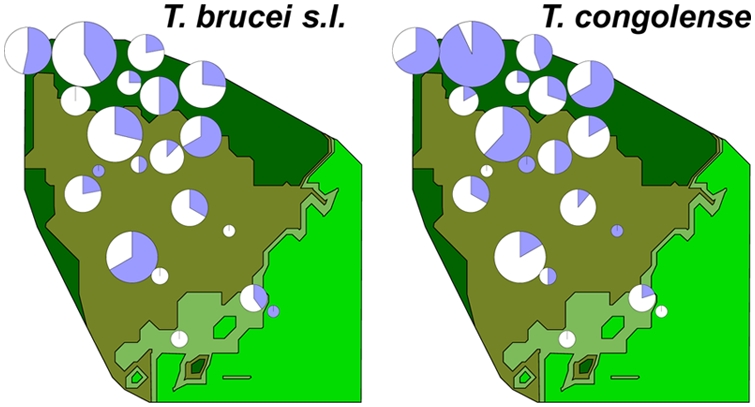
Map colours indicate habitat: woodlands (dark green), tall-grass plains (olive), intermediate grass plains (pale green) and short grass plains (bright green). Pie-charts show the proportion (in blue) of animals infected with either T. congolense or T. brucei; size of each chart is proportional to the number of lions sampled in each pride; each chart is centred at the approximate midpoint of each pride's territory.