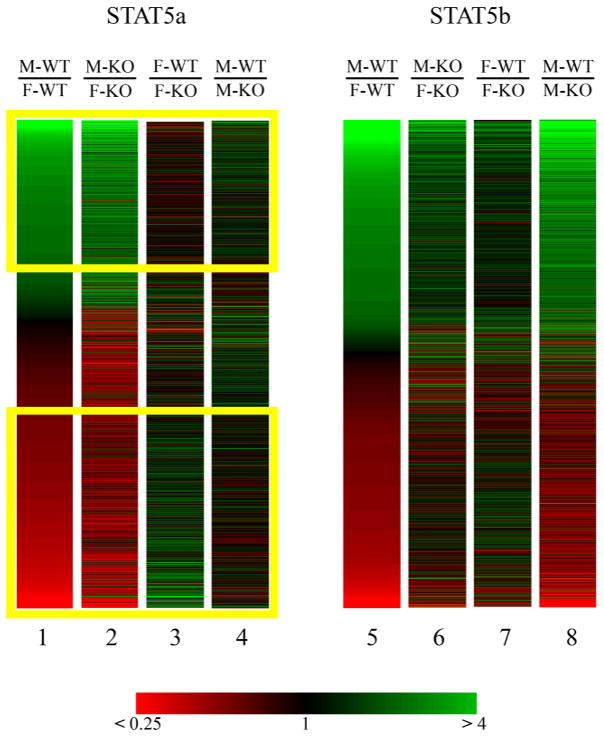
Fig. 1. False color heat maps for expression profiles of 3905 differentially expressed genes from the STAT5a-KO data set and 2231 differentially expressed genes from the STAT5b-KO data set.
Genes are depicted based on their mean expression ratios across four experimental pairings, as indicated on top of each column. Genes are colored according to the colorbar at the bottom, ranging from bright green for an expression ratio >4 to bright red for an expression ratio <0.25, with black corresponding to a ratio of 1. In lanes 1–4, 3905 genes from the present STAT5a data set are sorted according to the mean M-WT:F-WT ratio. The upper and lower yellow boxes enclose genes determined to be male-specific and female-specific, respectively (M-WT:F-WT >1.5 or <0.66 at p<0.05). In lanes 5–8, 2231 genes from the STAT5b-KO data set (5) are sorted according to M-WT:F-WT ratio.

