Figure 4.
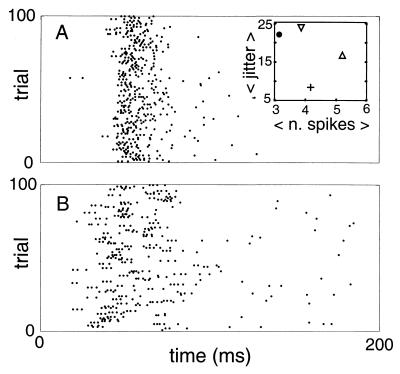
Experimental example showing that different “messages” elicit different noise (i.e., spike temporal jitter). Results were gathered from recordings in cat lateral geniculate nucleus, where neuronal action potentials are recorded in response to the presentation of a moving bar with different contrast and speed. Inset in A shows, for the conditions tested, the temporal jitter versus average number of spikes (collected during the window of 200 ms); ● corresponds to low contrast/high speed; +, to high contrast/high speed; ▿, to low contrast/low speed; and ▵, to high contrast/low speed. Notice the data from moving bars of different contrast originating very different jitter. The raw data for two of the experimental conditions are presented in the raster plots of A and B. Responses obtained with a moving bar of low contrast moving at low speed are plotted in B. The (less variable) responses obtained with a moving bar of high contrast moving at high speed are depicted in A.

