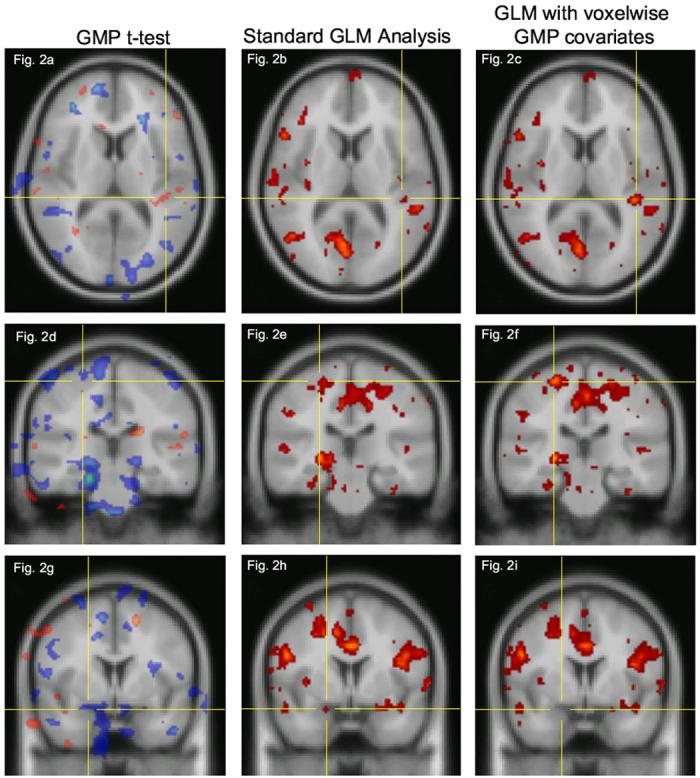
Figure 2.

Human fMRI activation results at three locations. Left column: t-statistic map for GMP differences between groups showing a 2-tailed t-test. Negative t-values are shown in blue, positive values in red. Center column: Standard GLM analysis. Right column: GLM analysis with voxelwise Gray Matter Probability (GMP) covariates included in the model. Color scale is the same for both functional SPMs (center and right columns), which have a lower threshold of t=1.9, set slightly below the statistical threshold of t=2.05 (p<0.05). Top row and middle row: the functional cluster designated by the crosshairs increased in both size and magnitude with GMP voxelwise covariates. Bottom row: the cluster designated by the crosshairs drops below the significance level when GMP voxelwise covariates are included in the model. Note how in all three rows, most of the clusters are unchanged. See text for description of data and analysis.
