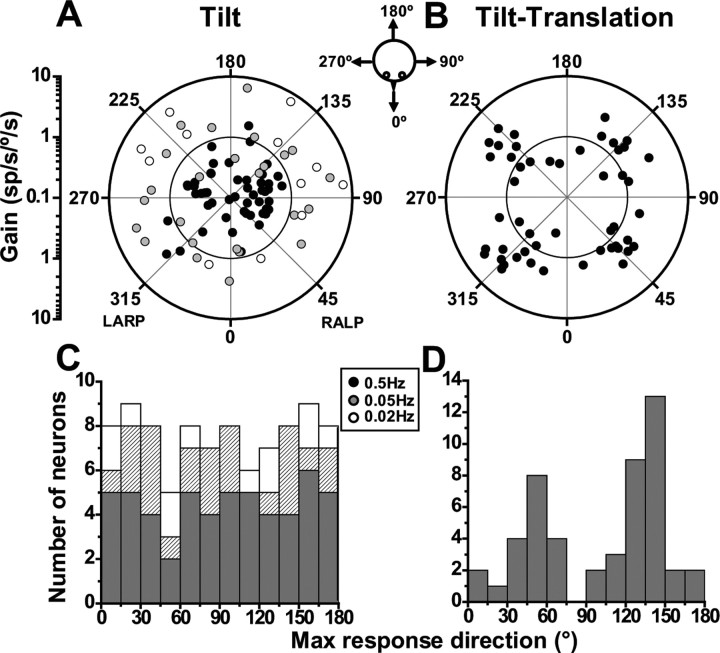
Figure 6.
Spatial organization of SS responses during tilt (0.5, 0.05, and 0.02 Hz) (A, C) and tilt-translation (0.5 Hz) (B, D). A, B, Polar plots, in which the radius corresponds to response gain (in units of spikes/second per degrees/second) and the polar angle illustrates the preferred direction. Each circle corresponds to one NU cell with significant response modulation along at least one direction in the horizontal plane. For all three frequencies, distributions of tilt preferred directions were not different from uniform (uniformity test, puni ≫ 0.05), unlike the preferred directions during tilt-translation and translation (Fig. 3B), which are clearly bimodal and clustered around the semicircular canal axes. C, D, Same data, now plotted as distributions of preferred directions in the range [0, 180°]. Tilt: n = 55 for 0.5 Hz (filled black symbols, black bars), n = 25 for 0.05 Hz (filled gray symbols, hatched bars), and n = 12 for 0.02 Hz (open symbols, open bars); tilt-translation: n = 50.

