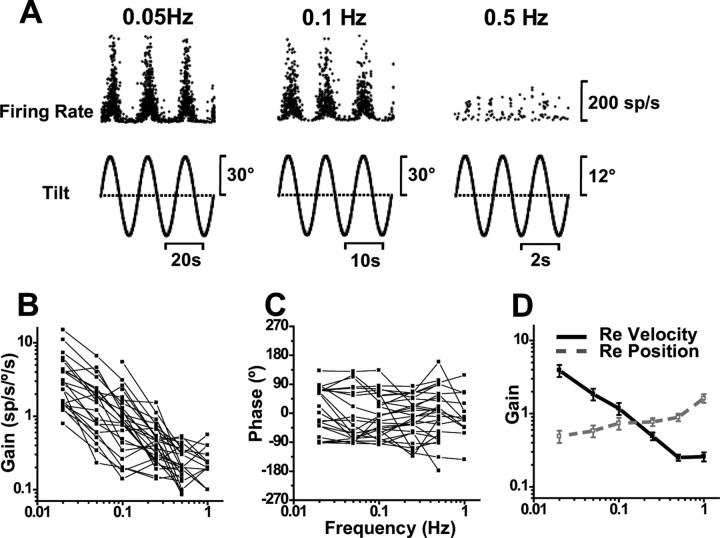
Figure 9.
SS dynamics during tilt. A, Sinusoidal responses of a Purkinje cell during pitch tilt at 0.05, 0.1, and 0.5 Hz. B, C, Shown is the frequency dependence of response gain and phase (expressed relative to angular velocity), plotted separately for each cell (n = 27). D, Average neural response gain plotted versus frequency, in which gain is computed either relative to angular velocity (filled symbols, black solid line) or relative to position (open symbols, gray dashed line).

