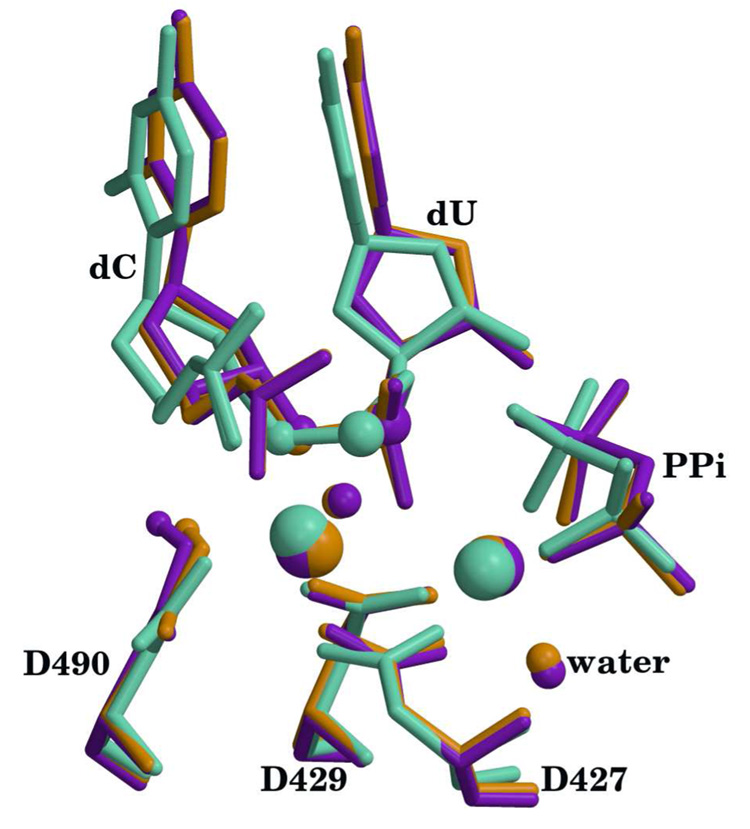
Figure 3.
Superposition of active sites for the calculated products with the X-ray crystal structure (pdb id 2PFQ). X-ray structure is shown in green, Mn2+ structure is shown in purple and Mg2+ structure is shown in orange. Hydrogen atoms except for the transferred proton have been omitted for clarity. The metals, O3′, Pα, waters that complete the metal coordination and the transferred proton are highlighted as spheres. Catalytic metal is on the left and nucleotide binding metal is on the right. Metal ligand distances are reported in table S1 (supplementary materials).

