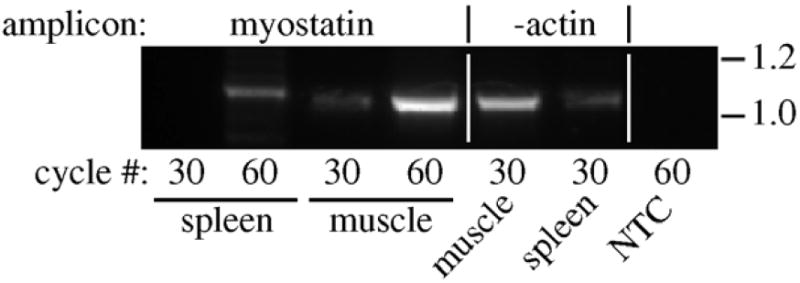
Fig. 6.

Myostatin expression in mouse spleen. Expression was analyzed by RT-PCR as described in Section 2 using total RNA from spleen and skeletal muscle. Myostatin cDNA was amplified for 30 cycles and then a 5 μl aliquot was re-amplified for an additional 30 cycles for a total of 60. β-actin was also amplified to assure cDNA quality and a no template control (NTC, with myostatin primers) was also included. Amplicon sizes (kb) are indicated on the right.
