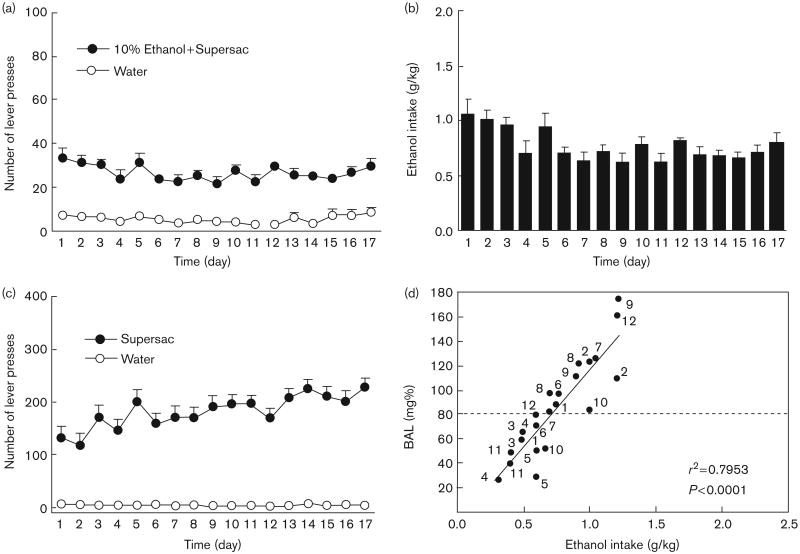
Fig. 3.
(a) Mean ± SEM number of lever presses for sweetened (3% glucose + 0.125% saccharin) 10% (w/v) alcohol solution, and (b) mean ± SEM intake (g/kg) of sweetened alcohol solution during the initial 17-day baseline binge period; (c) mean ± SEM number of lever presses for supersac (3% glucose + 0.125% saccharin) by controls during the initial 17-day baseline binge period; and (d) scatter plot of blood–alcohol levels produced by alcohol intake (g/kg) by animals in the alcohol binge group during two representative drinking sessions. Points are individually labeled with rat identification numbers to show that 8 of the 12 animals in the alcohol binge group achieved BALs ≥ 0.08 g% during at least one of the two drinking sessions.

