
Figure 5. Increased WAT inflammation and adipocyte lipolysis in Mac-PPARδ−/− mice.
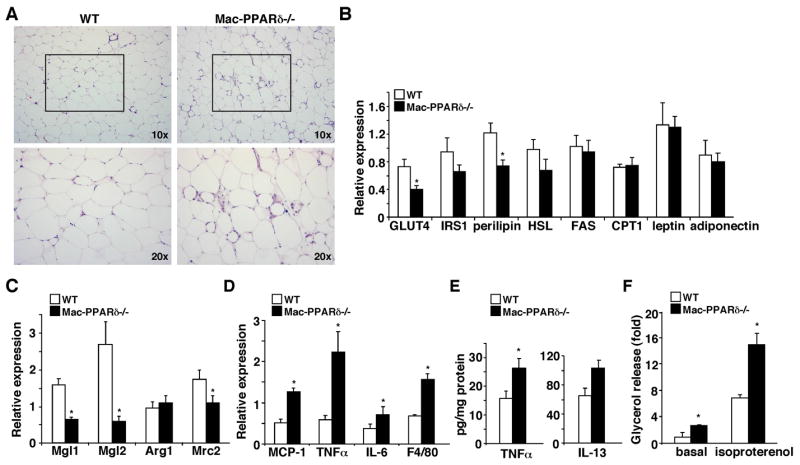
(A) Histological analyses of WAT sections (H & E staining) from high fat fed WT and Mac-PPARδ−/− mice. Mac-PPARδ−/− WATs contained small adipocytes that were surrounded by macrophages. (B) Analyses of metabolic gene expression in WAT by real-time PCR. IRS1: insulin receptor substrate 1; HSL: hormone sensitive lipase; FAS: fatty acid synthase; CPT1: carnitine palmitoyltransferase 1. (C) M2 markers are down-regulated in WATs of Mac-PPARδ−/− mice. M2 gene expression was determined by real-time PCR and normalized with F4/80. (D) WATs of Mac-PPARδ−/− mice exhibit elevated inflammatory gene expression. Gene expression was determined by real-time PCR. (E) Determination of TNFα and IL-13 protein concentration in WAT by ELISA (F) Increased lipolysis in primary adipocytes from Mac-PPARδ−/− mice. The rate of lipolysis was determined by glycerol release at the baseline or upon isoproterenol stimulation. Values are expressed as means ± SEM. *p<0.05, comparing WT to Mac-PPARδ−/− mice.