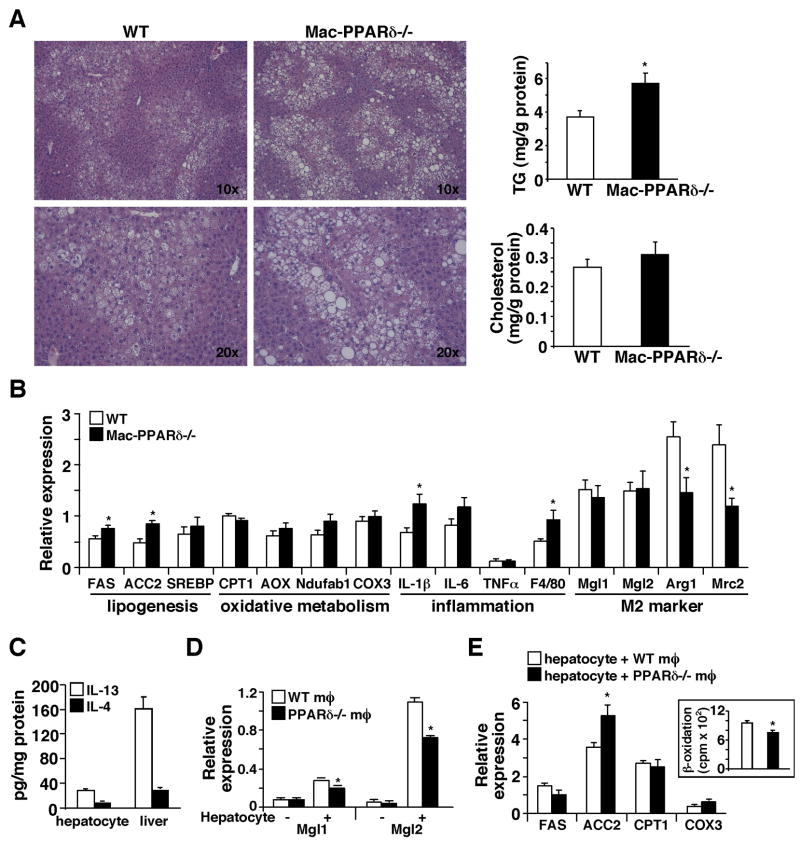
Figure 6. Mac-PPARδ−/− mice exhibit severe hepatic steatosis.
(A) Histological analyses of liver sections (H & E staining) from high fat fed WT and Mac-PPARδ−/−mice. Livers of Mac-PPARδ−/− mice contained larger lipid droplets. Hepatic lipid content was determined by enzymatic assays and normalized to protein content. (B) Analyses of metabolic and inflammatory gene expression in the liver by real-time PCR. ACC2: acetyl-CoA carboxylase 2; SREBP: sterol regulatory element-binding protein 1-c; Aox: acetyl-CoA oxidase. (C) Hepatocyes are a source of Th2 cytokines. IL-13 and IL-4 concentrations in lysates of isolated hepatocytes and liver were determined by ELISA. (D) M2 markers are induced in macrophages co-cultured with primary hepatocytes. Experiments were conducted similar to those in macrophage-adipocyte co-culture. The induction of Mgl1/2 was diminished in PPARδ−/− macrophages. The − and + signs indicate without or with hepatocyte co-culture. (E) Hepatocytes co-cultured with PPARδ−/− macrophages have increased ACC2 expression and reduced fatty acid oxidation. Insert: the rate of fatty acid β-oxidation determined by 3H2O production fromp 3H-fatty acids. Values are expressed as means ± SEM. *p<0.05.

